


Consolidated Income Statement Summary
for the year ended 31st December
| HK$ million | 2025 | 2024 | 2023 | 2022 | 2021 | 2020 | 2019 | 2018 | 2017 | 2016 |
|---|---|---|---|---|---|---|---|---|---|---|
| Profit attributable to shareholders |
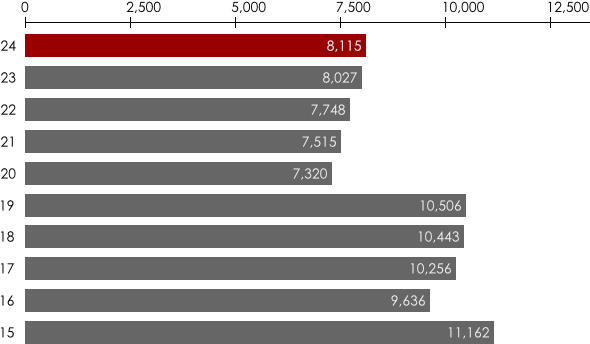
8,265 | 8,115 | 8,027 | 7,748 | 7,515 | 7,320 | 10,506 | 10,443 | 10,256 | 9,636 |
| Dividends | ||||||||||
| Interim dividend paid | 1,839 | 1,814 | 1,789 | 1,764 | 1,739 | 1,713 | 1,713 | 1,713 | 1,688 | 1,587 |
| Proposed final dividend | 4,737 | 4,687 | 4,661 | 4,611 | 4,560 | 4,510 | 4,485 | 4,410 | 4,309 | 4,107 |
| 6,576 | 6,501 | 6,450 | 6,375 | 6,299 | 6,223 | 6,198 | 6,123 | 5,997 | 5,694 |
Consolidated Statement of Financial Position Summary
as at 31st December
| HK$ million | 2025 | 2024 | 2023 | 2022 | 2021 | 2020 | 2019 | 2018 | 2017 | 2016 |
|---|---|---|---|---|---|---|---|---|---|---|
| Property, plant and equipment |
2,917 | 2,914 | 3,079 | 3,017 | 3,029 | 2,965 | 2,805 | 2,508 | 2,462 | 2,404 |
| Investment properties | 381 | 389 | 408 | 408 | 408 | 396 | 398 | 382 | 360 | 344 |
| Interests in associates | 40,063 | 38,068 | 39,240 | 38,527 | 37,998 | 37,133 | 36,814 | 38,191 | 43,108 | 52,177 |
| Interests in joint ventures | 110,520 | 102,148 | 104,093 | 99,302 | 106,802 | 106,803 | 104,952 | 95,892 | 98,462 | 53,973 |
| Other financial assets | 1,235 | 1,539 | 1,542 | 1,590 | 1,613 | 1,892 | 1,871 | 7,821 | 702 | 648 |
| Derivative financial instruments |
896 | 1,281 | 624 | 1,249 | 441 | 126 | 1,107 | 2,448 | 1,253 | 2,178 |
| Goodwill and intangible assets |
2,090 | 2,025 | 2,299 | 2,246 | 2,447 | 2,602 | 2,486 | 2,556 | 2,569 | 2,554 |
| Deferred tax assets | 3 | 1 | 1 | 3 | 6 | 6 | 3 | 12 | 7 | 29 |
| Other non-current assets | - | - | - | - | - | - | - | - | 136 | 64 |
| Current assets | 8,157 | 9,472 | 14,587 | 19,525 | 10,255 | 15,488 | 14,748 | 7,960 | 10,755 | 13,539 |
| Total assets | 166,262 | 157,837 | 165,873 | 165,867 | 162,999 | 167,411 | 165,184 | 157,770 | 159,814 | 127,910 |
| Current liabilities | (9,169) | (11,198) | (16,099) | (12,268) | (16,663) | (11,024) | (10,303) | (6,287) | (15,669) | (13,837) |
| Non-current liabilities | (19,241) | (15,396) | (16,503) | (24,217) | (20,489) | (30,125) | (28,507) | (29,579) | (25,953) | (7,886) |
| Total liabilities | (28,410) | (26,594) | (32,602) | (36,485) | (37,152) | (41,149) | (38,810) | (35,866) | (41,622) | (21,723) |
| Perpetual capital securities | (9,885) | (9,885) | (9,885) | (9,885) | (9,885) | (14,701) | (14,701) | (14,701) | (14,701) | (9,544) |
| Non-controlling interests | (57) | (78) | (93) | (104) | (128) | (119) | (69) | (30) | (18) | (38) |
| Equity attributable to shareholders |
127,910 | 121,280 | 123,293 | 119,393 | 115,834 | 111,442 | 111,604 | 107,173 | 103,473 | 96,605 |
Per Share Data
| HK$ | 2025 | 2024 | 2023 | 2022 | 2021 | 2020 | 2019 | 2018 | 2017 | 2016 |
|---|---|---|---|---|---|---|---|---|---|---|
| Earnings per share | 3.28 | 3.22 | 3.19 | 3.08 | 2.98 | 2.91 | 4.17 | 4.14 | 4.07 | 3.82 |
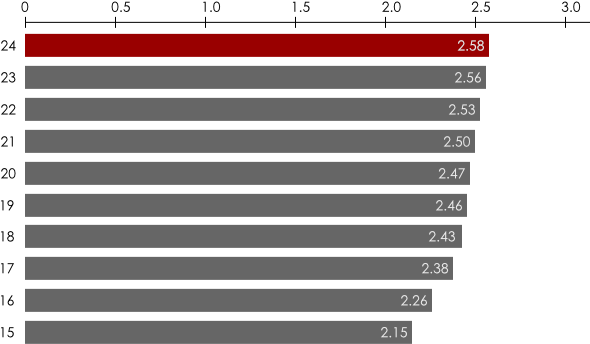
| Dividends per share | 2.610 | 2.580 | 2.560 | 2.530 | 2.500 | 2.470 | 2.460 | 2.430 | 2.380 | 2.260 |
| Shareholder's equity - net book value per share |
50.77 | 48.13 | 48.93 | 47.39 | 45.97 | 44.23 | 44.29 | 42.54 | 41.07 | 38.34 |
Profit Attributable to Shareholders
(HK$ million)
 |
Dividends Per Share
(HK$)
 |